Does investment performance matter in a group plan?

When it comes to investing, performance is one of the key determinants for successful investing. My guess is every investor wants the best returns. Unfortunately, this also leads investors into one of the biggest mistakes which are chasing performance.
Looking at past performance is a normal component of investment research. The problem is the investment industry is always quick to throw out that standard disclaimer “Past performance is no indication of future performance”. Unfortunately, it’s true! If it’s true, then why do we put so much weight on past performance numbers thinking that the best performers of the past will be the best performers of the future?
Group investment options are limited
When it comes to Group RRSPs, Defined Contribution Pensions (DC), Deferred Profit Sharing Plans (DPSP) and the soon to be Pooled Registered Pension Plan (PRPP), investment options are more limited than the retail universe of thousands of investments.
One of the expectations in a group retirement plan is that someone is going to filter through all the investments to make sure the duds are replaced by the ‘best of the best’. That might sit on the employer’s shoulders but more often than not it is an advisor, benefits broker or consultant.
No such thing as the best
As someone who has done this work and spent a lot of time researching the numbers, I have come to the unpopular conclusion that there is no such thing as the best. There is such a thing as the best for a certain period of time but there is no such thing as best all the time. If there was, then why are there so many choices?
To illustrate this point, I took a sample of balanced funds. Why balanced funds? Because they are by far the most popular investment choice within-group retirement programs. That being said, I have done the same analysis with bond funds, Canadian equity funds and global funds and the same conclusion applies . . . there is no such thing as the best fund. Here’s the data of balanced funds:
| Fund Name | 2010 | 2009 | 2008 | 2007 | 2006 | 2005 | 2004 | 2003 | 2002 | 2001 |
| Great-West Life Bal (B) NL | 7.9 | 11.3 | -10.8 | -1.0 | 9.8 | 7.4 | 7.0 | 12.8 | -8.3 | 4.9 |
| IA Canadian Balanced A | 9.3 | 22.0 | -21.5 | 1.9 | 9.8 | 7.1 | 3.2 | 10.6 | -8.6 | 2.7 |
| IA Diversified | 7.6 | 19.0 | -14.9 | 0.6 | 9.7 | 11.3 | 8.7 | 13.1 | -1.1 | 0.8 |
| Manulife GIF 1 Simplicity Balanced | 7.7 | 18.1 | -20.8 | -1.8 | 10.3 | 8.1 | 6.9 | 12.4 | -8.4 | -1.2 |
| RBC Balanced | 8.8 | 13.4 | -20.3 | 4.1 | 10.9 | 14.6 | 8.1 | 14.4 | -6.4 | -4.6 |
| Standard Life Balanced A | 7.7 | 11.2 | -17.4 | 3.2 | 9.8 | 11.7 | 5.0 | 10.4 | -5.9 | -3.3 |
| SunWise CI Signature Cdn Balanced Basic | 9.0 | 20.8 | -15.6 | 2.2 | 14.1 | 16.8 | 10.0 | 14.7 | -9.4 | |
| CIBC Balanced Index | 9.4 | 13.7 | -13.8 | 2.6 | 10.7 | 10.7 | 7.2 | 10.2 | -8.0 | -6.2 |
The results: My interpretation of the data
- I selected funds with a 10 year history to get a long time frame and no fund consistently performed the best year after year.
- The numbers highlighted in green represent the best of the group that year and the red represents the worst of the group that year. Performance year by year is random.
- Hindsight is easy but there is no way of knowing which fund will be the best in the future. In other words, which of these funds will be the best in 2011? You have a 1 in 7 chance of being right.
- One might say that of this group, Sun Life has the best fund with 4 consecutive years as the best fund but since that run, it has not been the best in the last 4 years.
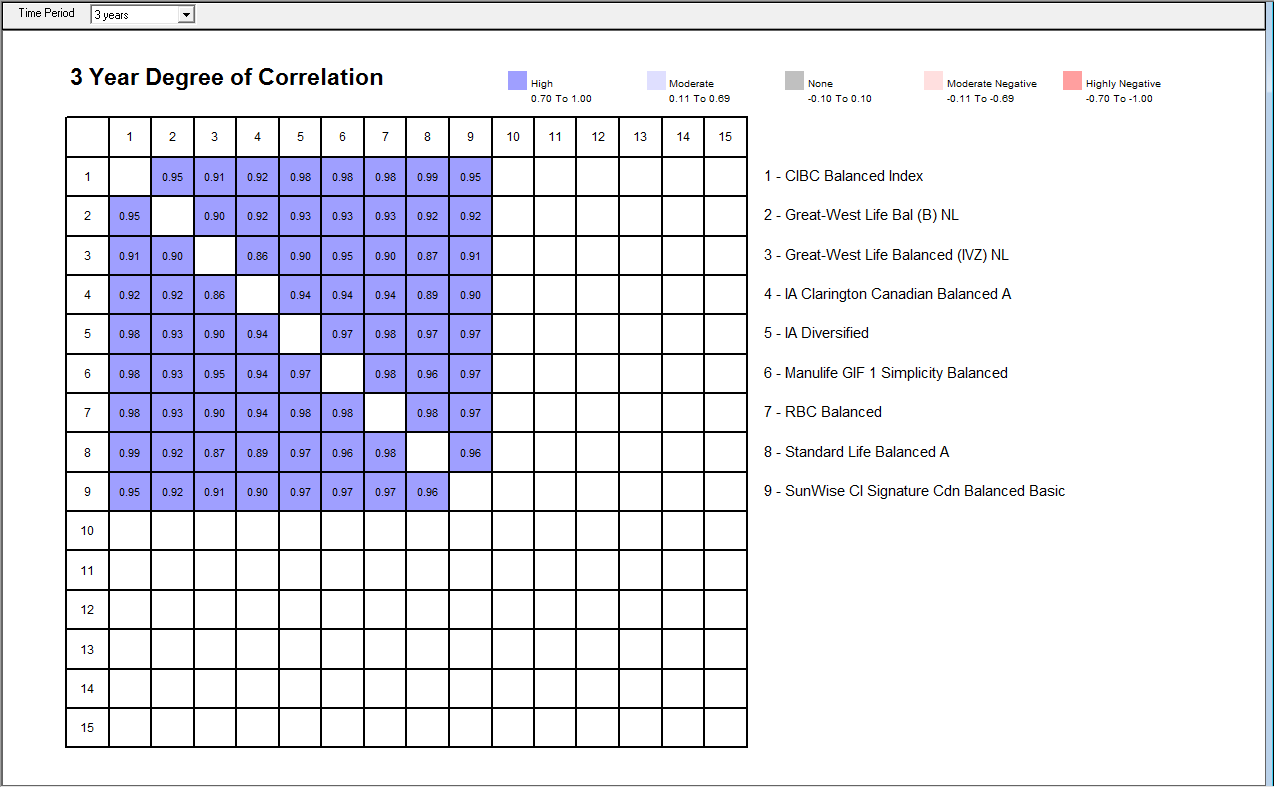
- In the last 10 years, there have been 4 tough years (2001, 2002, 2007 and 2008). In those years, all these funds moved together.
- In other words, all these funds are highly correlated (0.87 to 0.98 correlation). Here’s what a correlation chart looks like:
The bottom line is investment performance is somewhat random. It’s important to weed out the consistent poor performers but those investments naturally dissolve on their own.
The key to a good group plan has less to do with investment performance because performance is likely to be very similar. The key is to focus on the bigger benefits of contribution matching from the employers, low fees from group scale and convenience of payroll deduction.
