Mutual funds underperform the benchmark
Very recently, I used a trailing returns chart to show the challenges of predicting stock market returns .
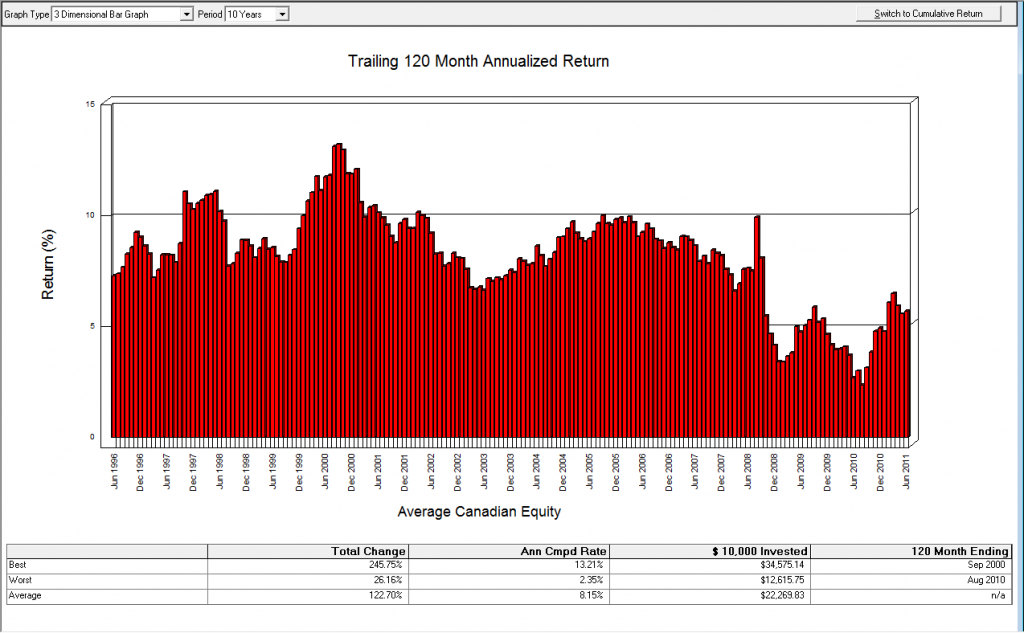
I thought I would use this same chart to illustrate another point that funds seem to underperform the benchmark. Below you will see two trailing return charts. The first is the trailing 10-year returns for the TSX and the second is the 10-year trailing returns for the Average Canadian Equity Mutual Fund over the same time frame.

What do you see?
Visually the charts look almost identical. What was most interesting to me was some of the detailed numbers:
| TSX | Average Canadian Equity Mutual Fund | Difference | |
| Best | 15.59% | 13.21% | 2.38% |
| Average | 9.23% | 8.15% | 1.08% |
| Worst | 2.84% | 2.35% | 0.49% |
If you look at the difference between the average annualized returns of the index vs the average of all funds, there is a 1.08% difference. Why is that over 10 year periods, the index has outperformed the average of all mutual funds? In fact, the data is consistent over different time frames.
Trailing 5-year returns:
| TSX | Average Canadian Equity Mutual Fund | Difference | |
| Best | 22.08% | 17.74% | 4.34% |
| Average | 9.15% | 7.97% | 1.18% |
| Worst | -1.91% | -1.59% | -0.32% |
Trailing 1-year returns:
| TSX | Average Canadian Equity Mutual Fund | Difference | |
| Best | 63.42% | 44.17% | 19.25% |
| Average | 10.16% | 8.49% | 1.67% |
| Worst | -38.20% | -37.84% | -0.36% |
One of the issues might have something to do with the fees or Management Expense Ratios (MER) charged by mutual funds. I’ve done some research in the past showing that there is a correlation between lower fees and better performance over the long run.
How much of this difference in these examples have to do with the fact that mutual funds charge fees? I would say fees definitely have something to do with the difference. Since the data is simplistic, it can be dangerous to jump to the conclusion that fees are the only cause for the underperformance of mutual funds compared to the index.
Whatever the case may be, this data supports the notion that although there may be a place for mutual funds, it is important for investors to find ways to understand the fees they are paying for those funds and whether they are getting value for those fees. This data shows averages of hundreds of mutual funds (637) in the Canadian Equity category but in that group, there are some mutual funds that may have outperformed the index but more than underperformed the index. In this group, there are mutual funds that have low fees (less than 0.5%) and others with high fees (more than 5%). In this group, there are both active management styles as well as passive styles. As an aggregate, this data shows that it is difficult for mutual funds to outperform the market index or benchmark.
I also ran these charts for Canadian Fixed Income but I’m not as confident about my data on the benchmarks for fixed income. The bottom line is the funds underperformed in that category as well.
| Morningstar Can Fixed Income Benchmark | Average Canadian Fixed Income Fund | Difference | |
| Best | 10.37% | 10.36% | 0.01% |
| Average | 7.01% | 6.86% | 0.15% |
| Worst | 4.11% | 3.76% | 0.35% |
What do you make of this data? Do you think the conclusion that funds underperform the benchmark is fair?
Comments
I really enjoyed this post Jim. Years back I read one of the Motley Fool books and it discussed this exact topic. From their research mutual funds simply don’t perform well against index funds. Fees, turnover, taxes, they all eat into the return and over time the power of compounding returns. I think your research reflects this.
cheers
Jim,
Good post, and certainly a topic that has received much debate. The numbers don’t lie. The “average” Canadian equity fund has underperformed the benchmark over the past 10 years.
There are a few counterpoints worth noting, however. There is an abundance of high fee and index-hugging products in the universe of Canadian equity funds, which serve to dampen the average performance figures. Further, the benchmark returns do not include any fees, which make the underperformance look more dramatic. And let’s not forget that every ETF and index fund will also underperform the benchmark due to fees (and tracking error).
If you want to beat the index, you need to look different from it. A study out of Yale (on ‘Active Share’) concluded that funds that are the most active (don’t look like the index) tend to outperform their benchmark.
If you pay a reasonable price for truly active management (not closet indexing) you can beat the benchmark. If you pay an “average” price for “average” management, you’re going to underperform.
I am certain the MER affects the return adversley to the detriment of the RRSP fundholder. All funds underperform because they pay their staff too much to manage it. They take off the MER whether you make or loose money. Plus the TD take $ 50.00 off for another fee annually now. Look at all the fund return rates for all the RRSP’s and other than the Royal bank precious metals fund and TD precious metals fund, they return very little over 10 years and longer. Buy and hold does not work any more. Adds tell you not to switch horses but when a fund goes up and down and you stay in it you whipsaw and make 4% a year over the long term. Can not retire on that.