The science of building a diversified investment plan
I’ve seen a lot of different portfolios in my professional career and one of the most common things I see is too many holdings. Diversification has been a long-standing principle in the investment world. Unfortunately, for many diversifications is misunderstood. The problem with diversification is it has been treated more like an art than a science. For most people diversification is more about quantity rather than efficiency. In most cases, you can optimize a portfolio with 5 to 12 investments.
The key is to have a properly allocated investment plan and then having the discipline to stick with that plan. This can be problematic in that it can be difficult to create a ‘properly allocated investment plan’. Secondly, it can be difficult to stick with it. Let’s tackle the first issue.
Building a properly allocated investment plan
There is a science to investing. this process called asset allocation. In the most basic form, asset allocation is simply spreading your portfolio between 3 basic asset classes: cash, bonds, and stocks.
The world has gotten a little more complicated and now each asset class has a myriad of choices. For example, with bonds, you can have government bonds, corporate bonds, high yield bonds, real return bonds, short bonds, long bonds, and even junk bonds.
On the stock side, it’s even worse because you now can have access to different parts of the world like Canada, the US, Europe, Asia, and emerging markets. You also have stock with a different market capitalization (small cap vs large cap). You can focus on specific sectors like health care, technology, gold, resource and much more.
Despite all this choice you have to find a set of investments that work well together. It’s kind of like building a car (not that I know how to do that). To make a car move you need different parts that work together like an engine, a steering wheel, tires, etc. A car with 10 tires and no engine probably would not work very well. Unfortunately, I see a lot of portfolios with the equivalent of 10 tires and no engine.
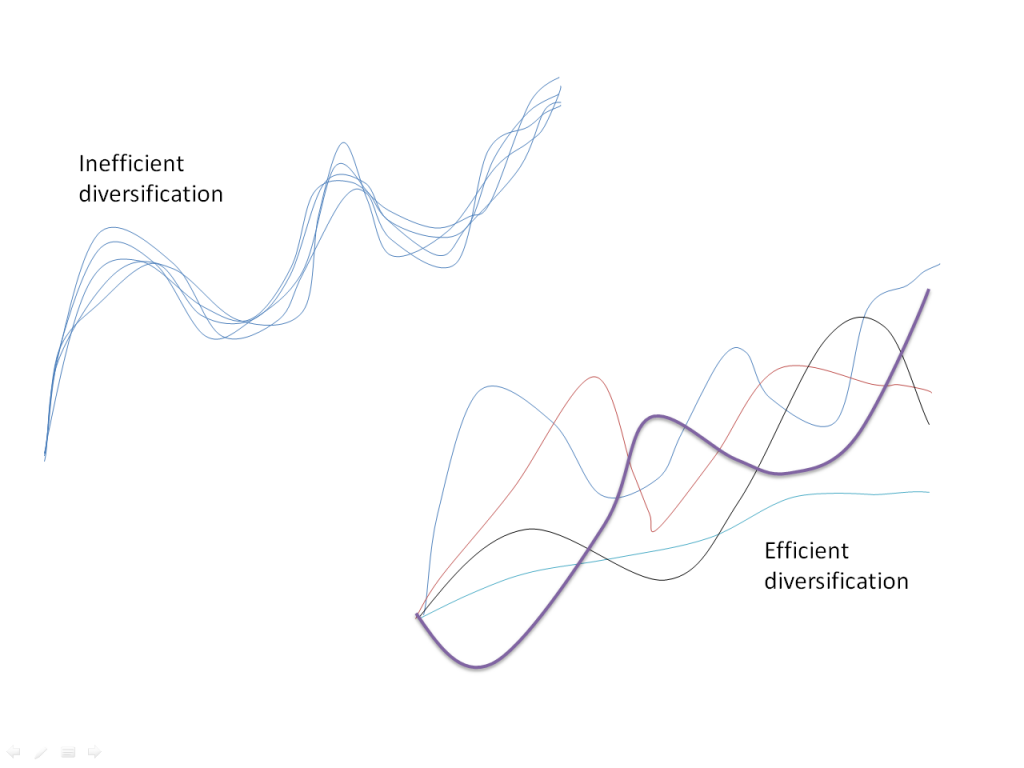
The easiest way to illustrate this is with a simple diagram.
 In this diagram, we have two portfolios with 5 different investments. The first portfolio has 5 investments that do the exact same thing. All 5 investments go up and at the same time and all 5 investments go down at the same time. The second portfolio is more efficient because it simply has a portfolio of 5 investments that do different things at different times which helps mitigate risk. This is called efficient diversification.
Correlation data measures diversification
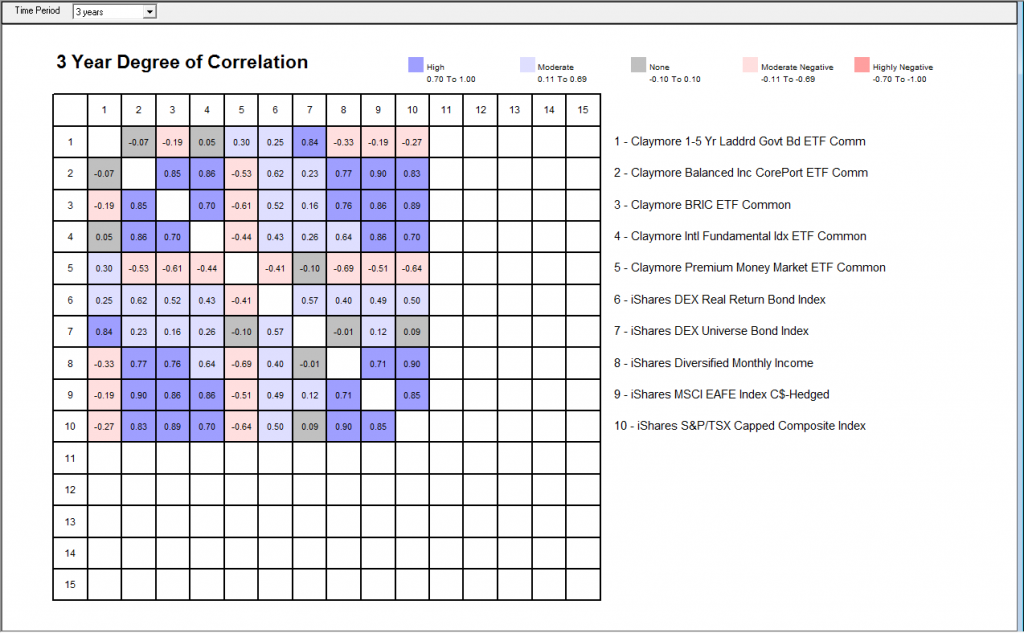
To take this one step further, if you want to see what good diversification looks like, you can check out a correlation grid.

Instead, this chart has lots of colors. There are many ways to interpret the chart but suffice it to say that there is very little duplication in this portfolio of investments. One might argue that investment 2 (Claymore Balanced Inc Core Port) and 9 (iShares MSCI EAFE Index) are highly correlated but there are still really different investments so the correlation can change in the future.
Anyhow, that’s a quick lesson on the science of building a diversified investment plan.
Comments
Great post Jim! It gives me a good reminder to actually check the correlation coefficients for the different mutual funds I hold. Since I have a good mix between different types, I have sort of just been assuming that the correlations would be low enough, but it’s good to actually check.
Great post, such a long time to see a graph which is not related to stock pricing. very good job Jim!
Hi Jim.That was really excellent and about the asset allocation i was impress well done.